From Screenshot to Full Underwriting in Under a Minute
Most real estate investors run the same workflow on every deal. Find a listing, copy the price and rent numbers into a spreadsheet, fill in expense estimates, add financing terms, and wait while formulas calculate. Then realize the deal does not pencil and start over on the next one. At 30 to 60 minutes per deal, that limits most investors to a handful of properties per week.
Realastat replaces the copy-paste loop with a different workflow: upload a screenshot, get a full underwriting in under a minute. Here is exactly how it works.
Step 1: Find a listing and capture a screenshot
Pull up any rental listing on Zillow, Redfin, or your MLS and take a screenshot. For the best extraction results, capture the full listing view that shows purchase price, number of bedrooms and units, listed rent if available, property taxes, and any HOA fees. For PDF listings from wholesalers or your agent, you can upload the PDF directly.
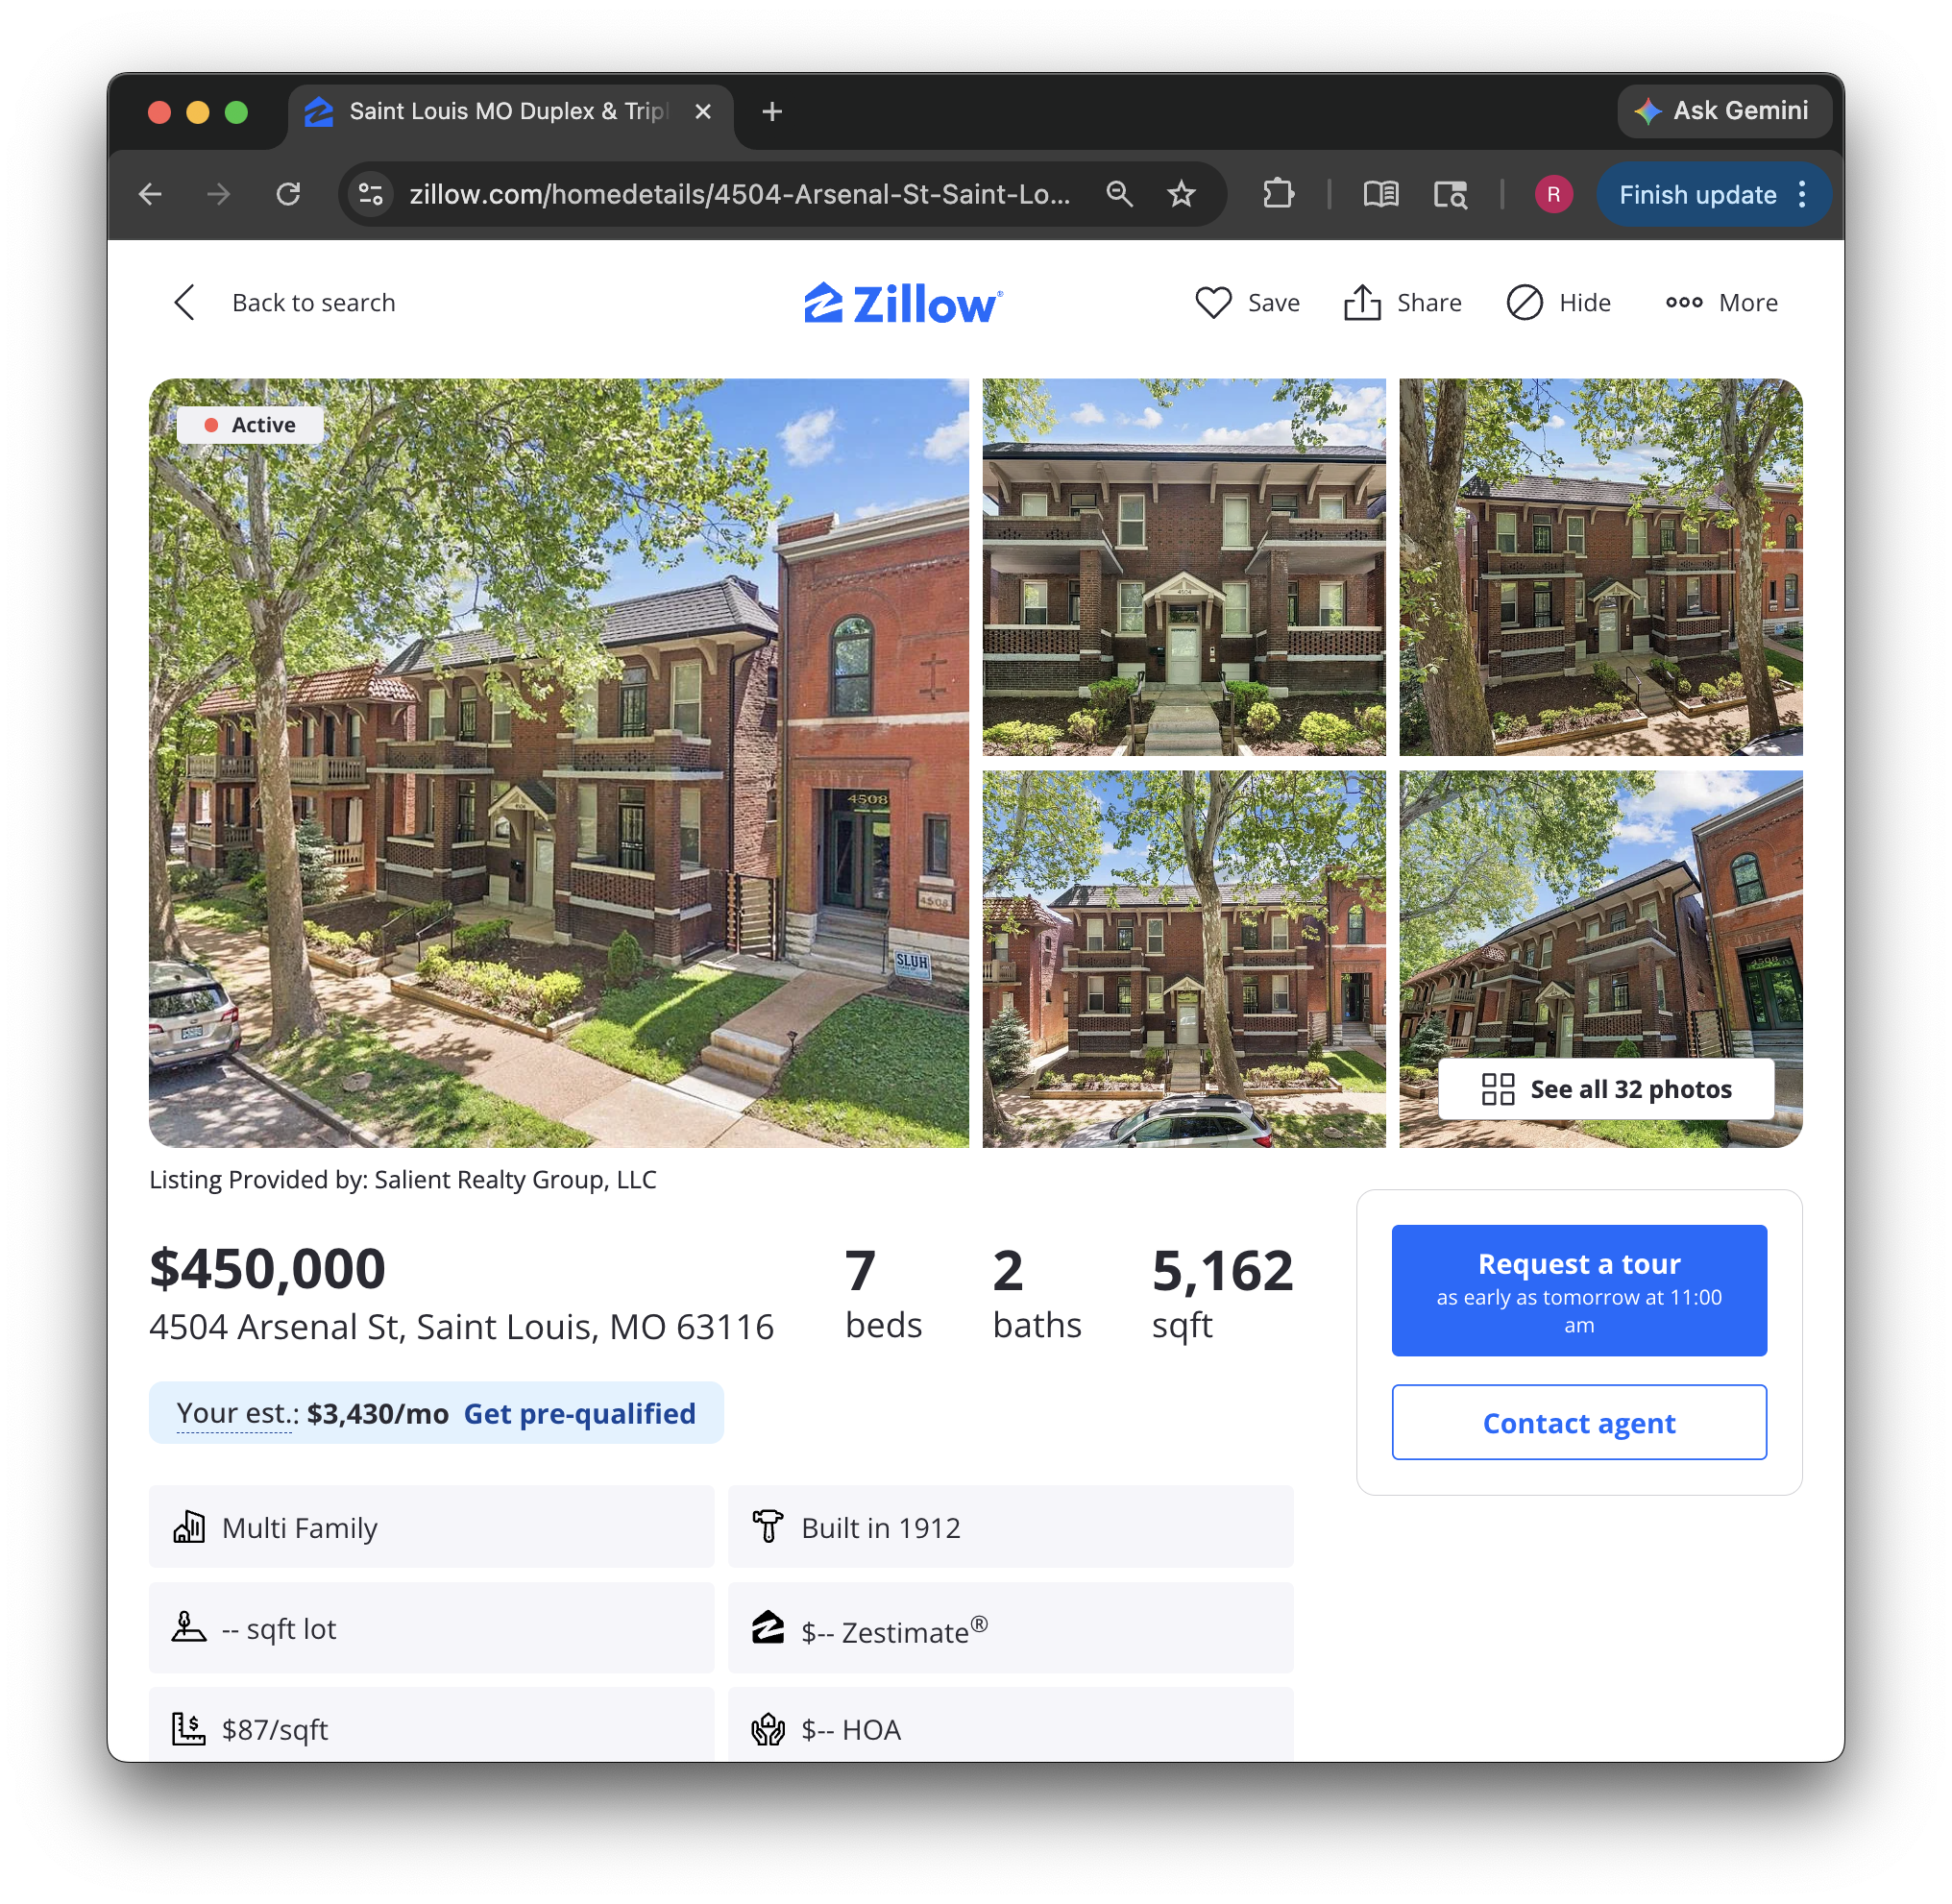
You do not need a perfect screenshot. Realastat handles partial information and will estimate missing values like rent or taxes from local market data, flagging anything it inferred so you can verify.
Step 2: Upload to Realastat and select your market
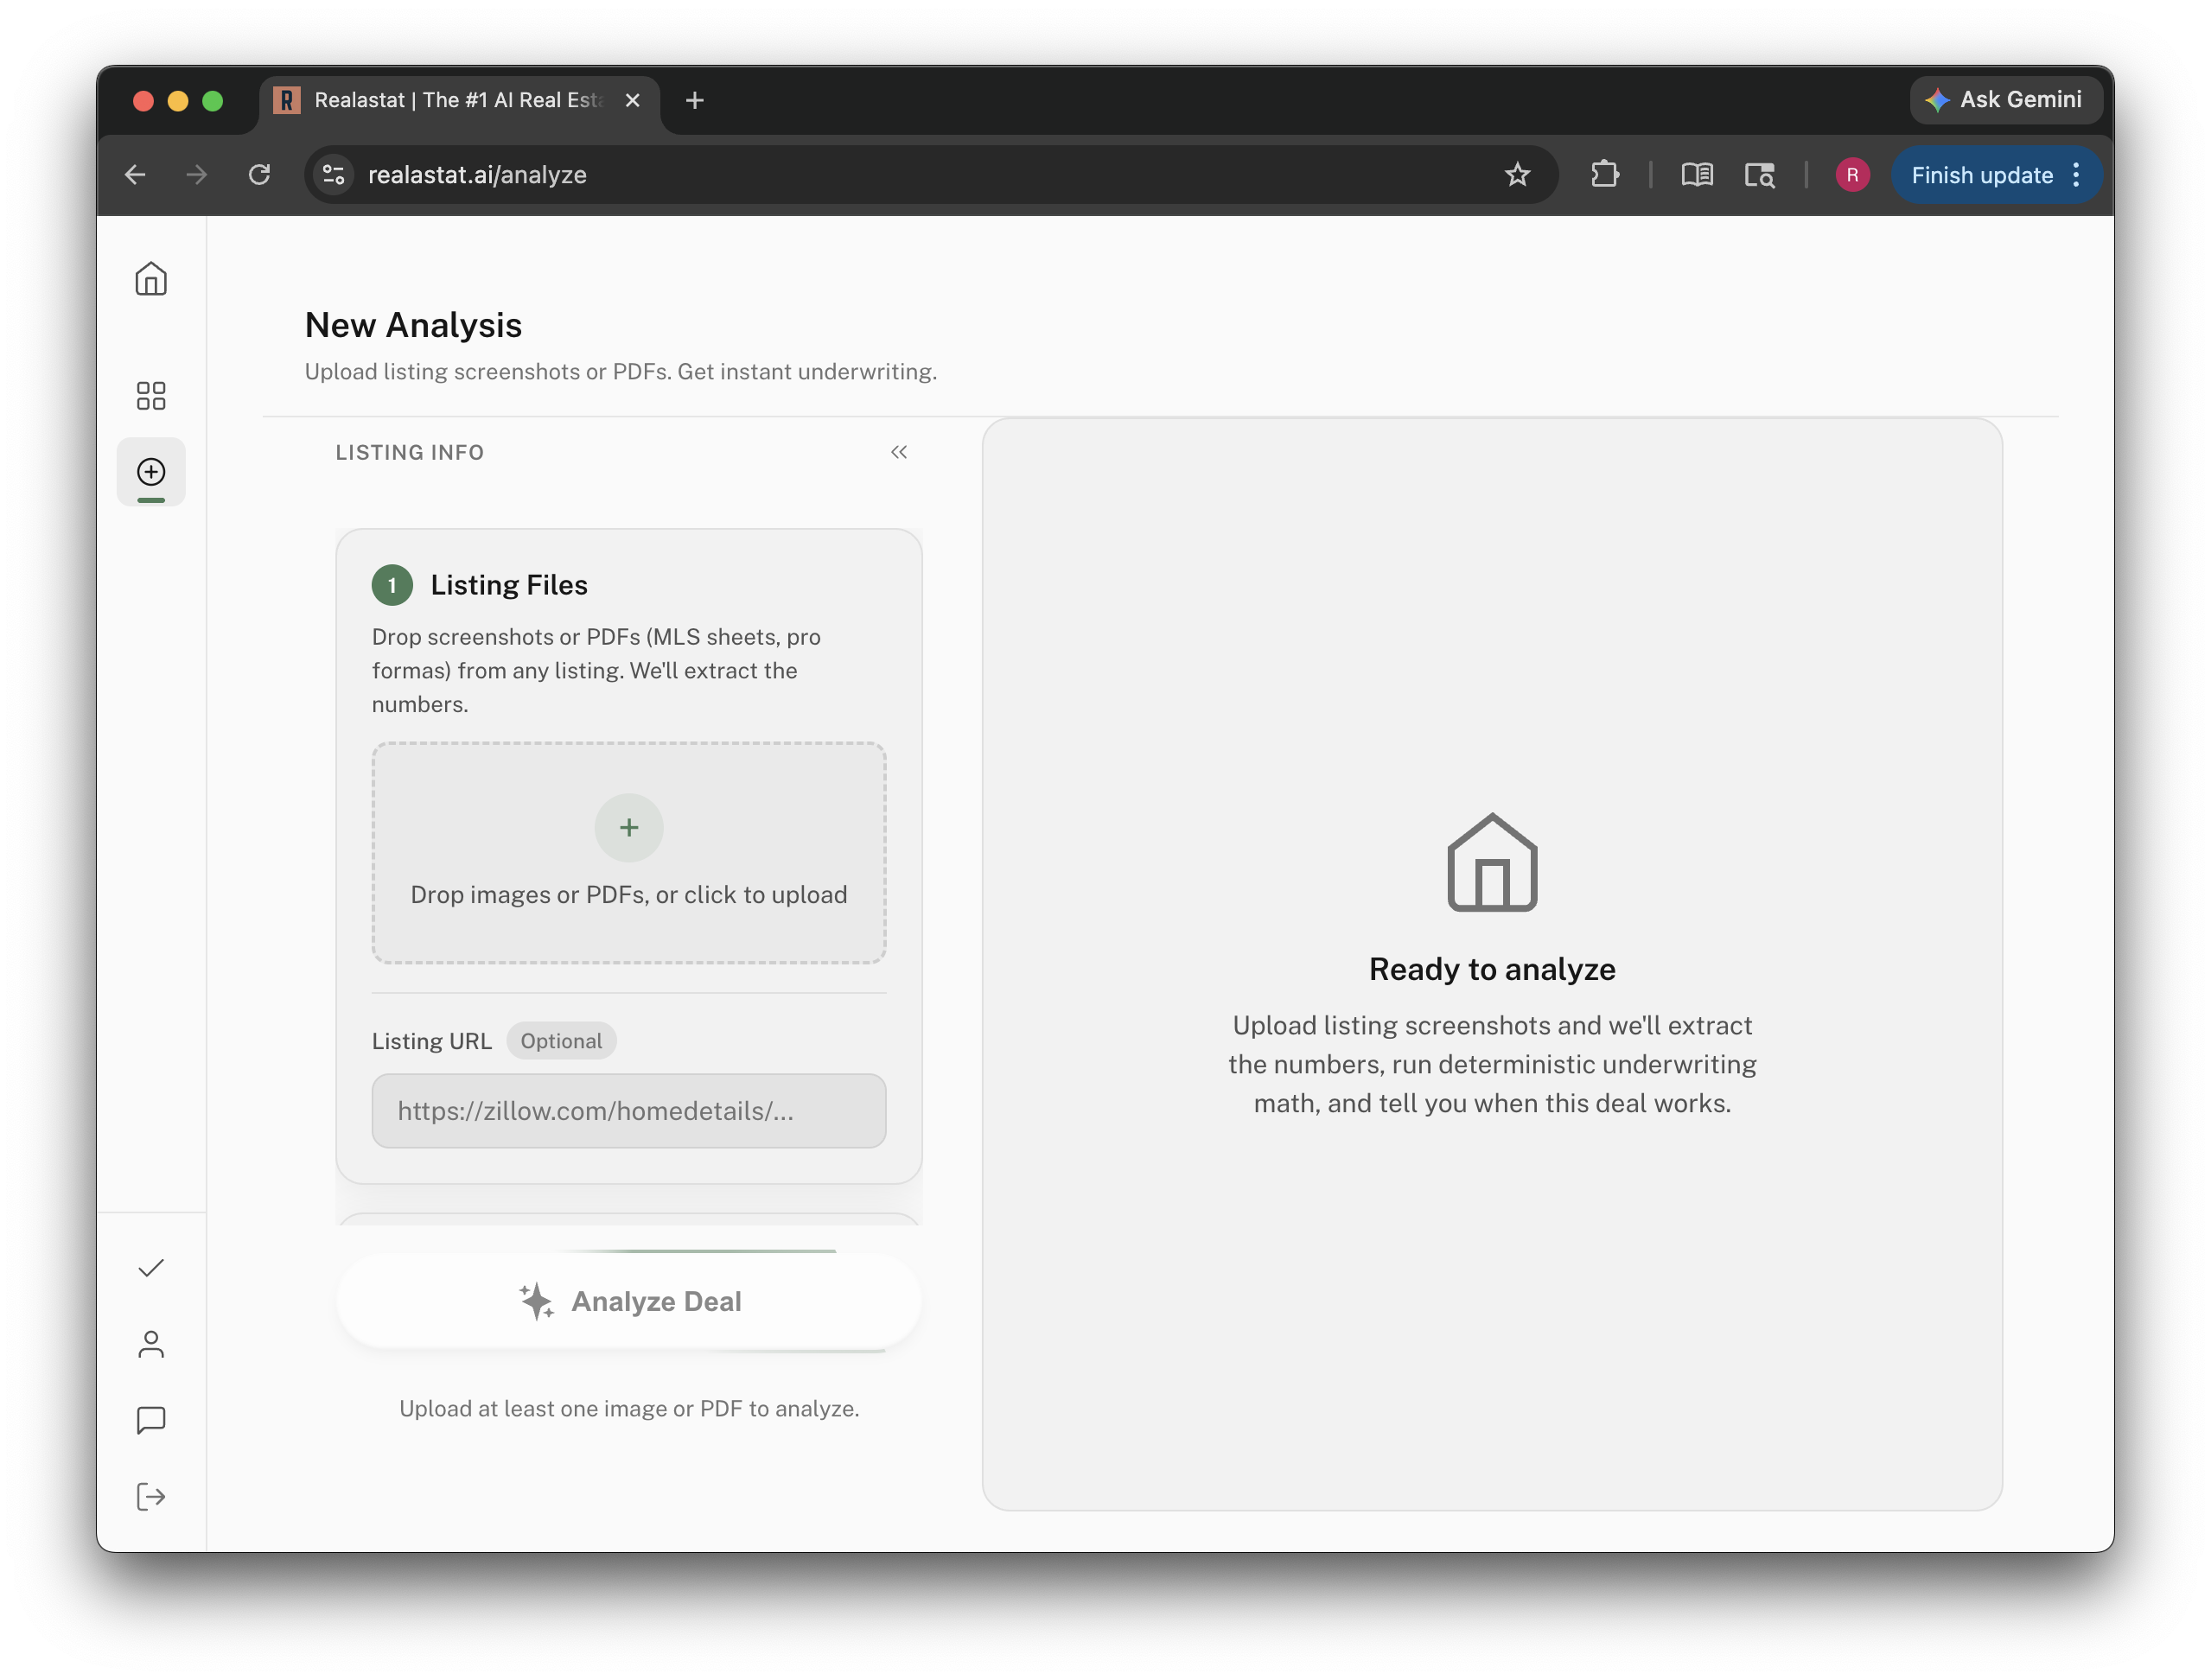
After signing in, click Analyze New Deal and drag your screenshot into the upload area. Realastat supports PNG, JPG, and PDF formats. Once uploaded, select the market region that matches the property. Realastat auto-detects the market from the property address in most cases and applies the appropriate regional assumptions for vacancy, expenses, and financing.
Step 3: AI extracts the property data
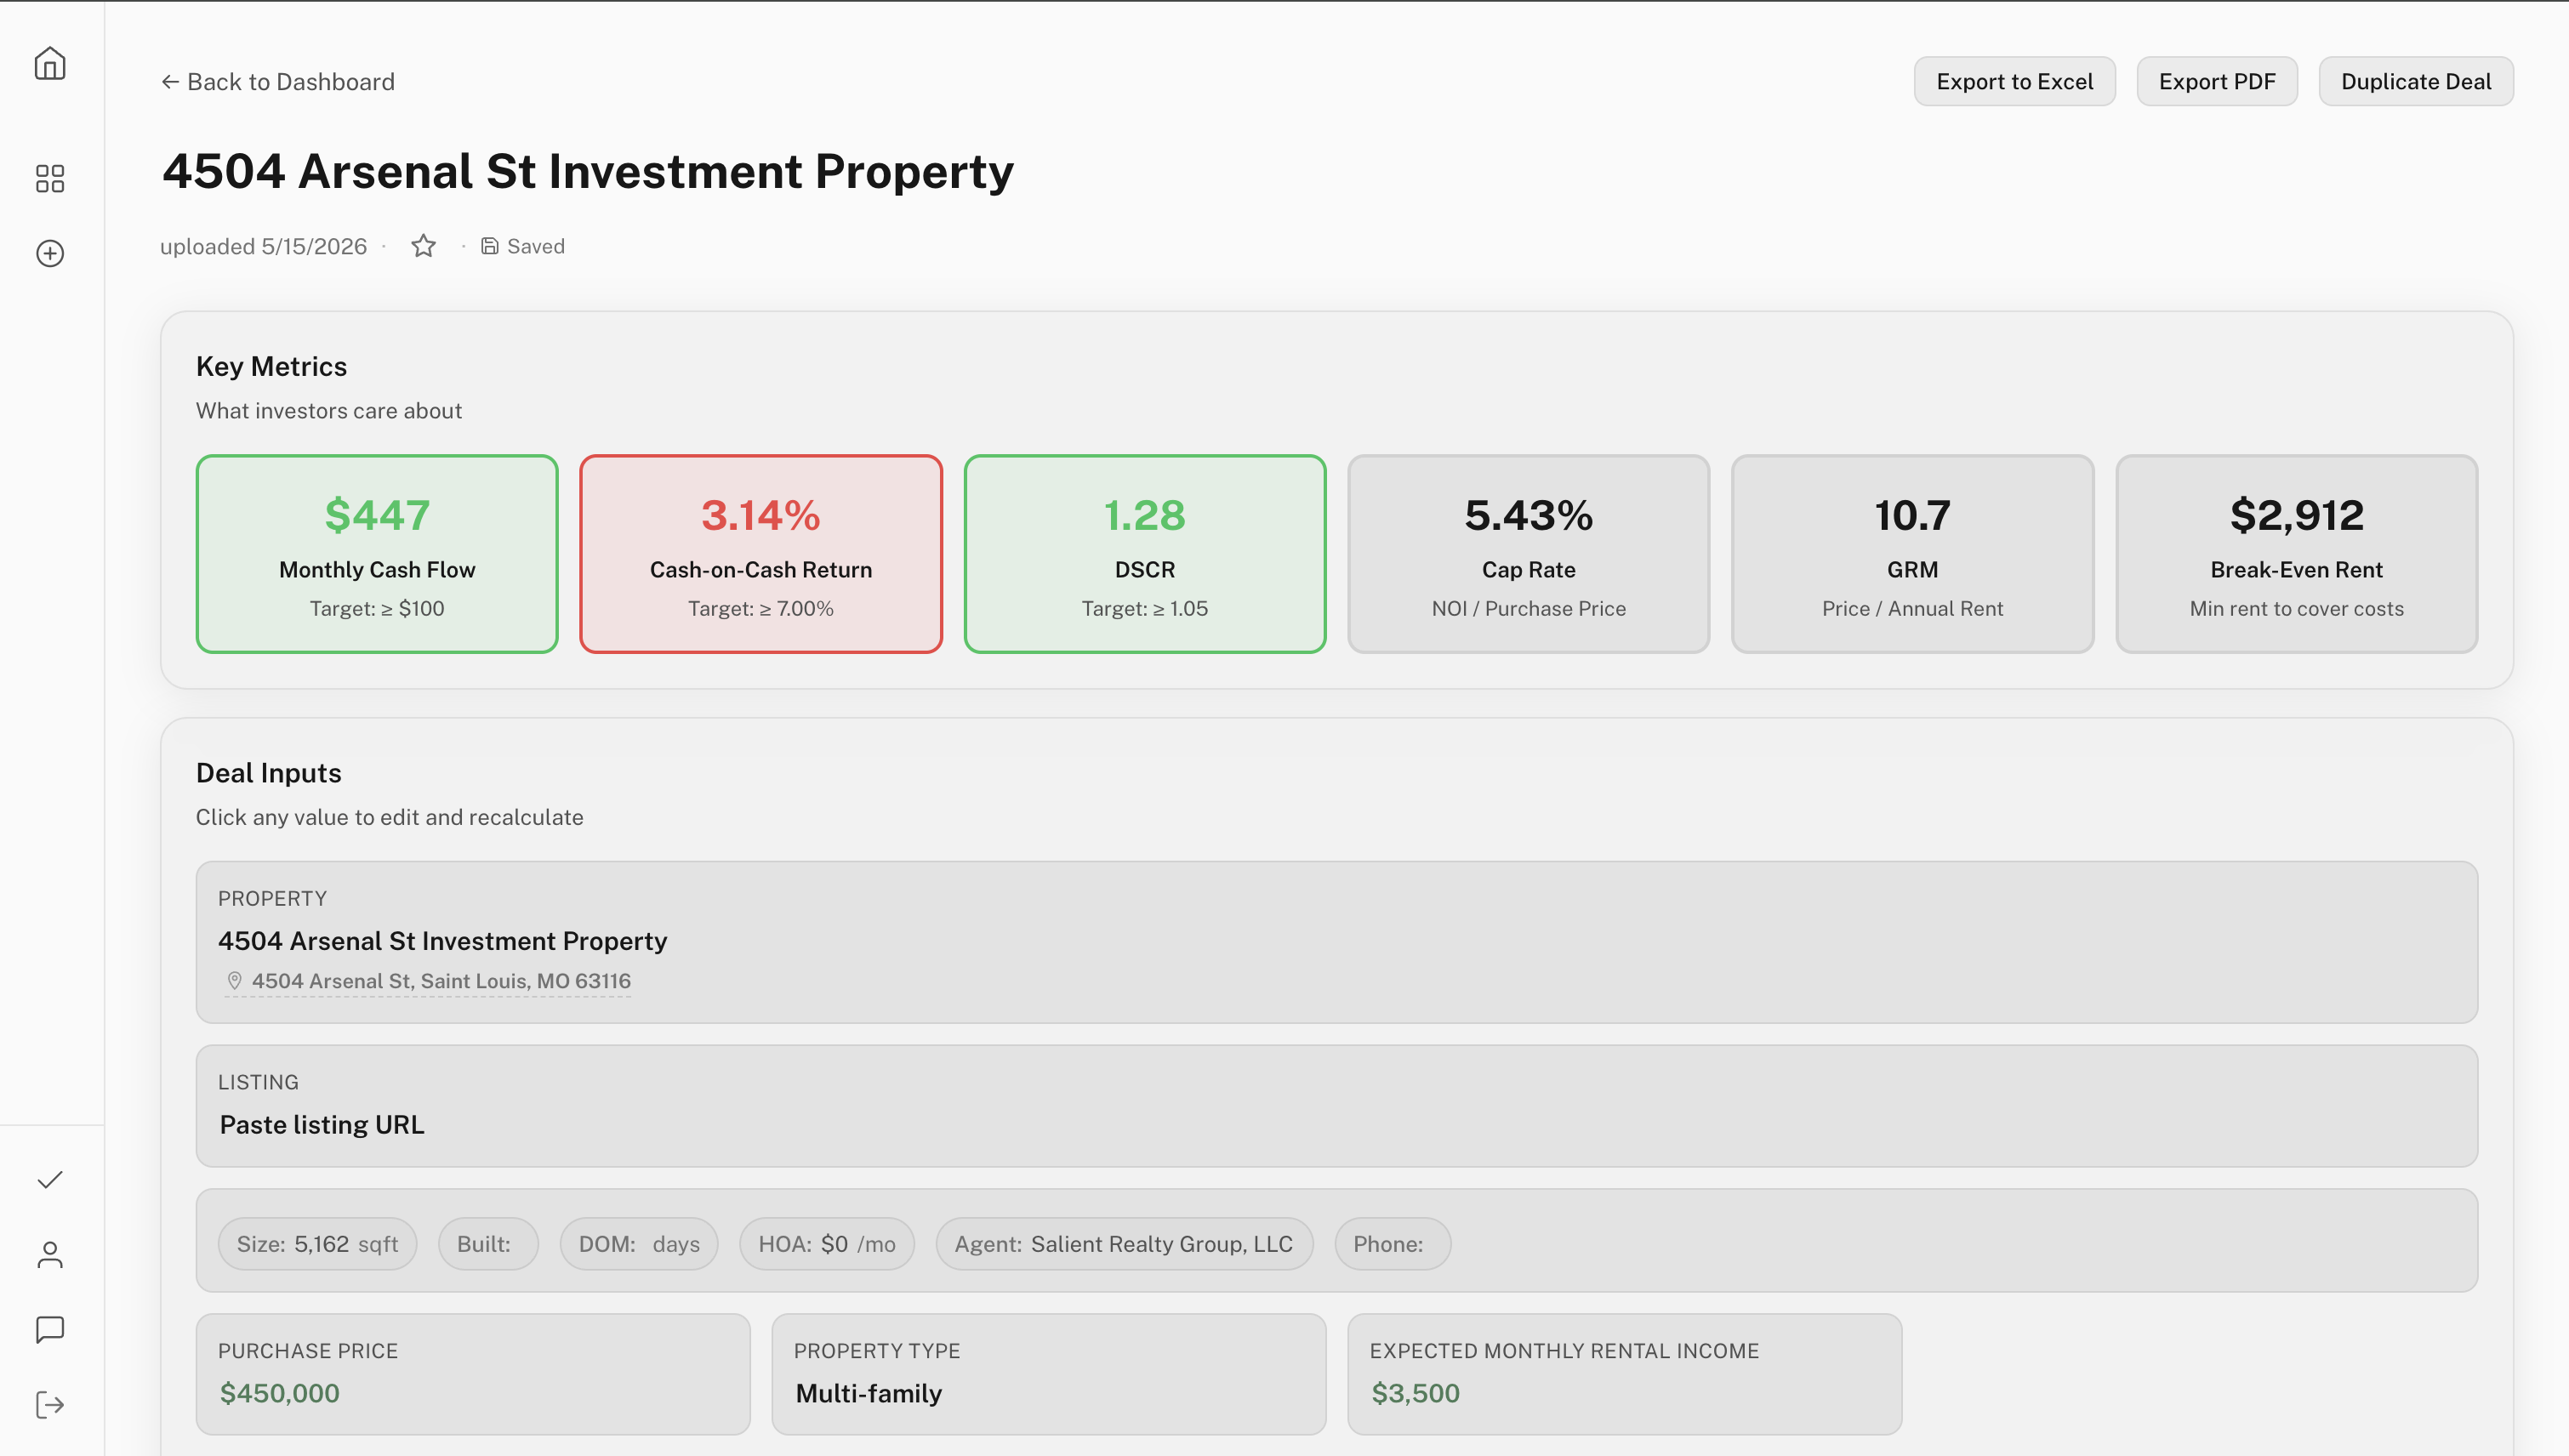
After upload, Realastat runs a multi-step AI pipeline. It extracts the purchase price, number of units, bedrooms per unit, listed rent, property taxes, HOA fees, and any other visible details from your screenshot. For values not present in the listing, it estimates from local market data and flags them clearly so you know what was extracted versus inferred.
This takes roughly 30 to 60 seconds. The AI handles the data entry so you do not have to.
Step 4: Review and correct the inputs
Before reading the metrics, scan the extracted inputs. Click any value to edit it. The most important things to verify are: purchase price (should match the listing exactly), gross rent (if the listing shows current rent vs market rent, use whichever is realistic for your underwriting), and property taxes (AI estimates can vary, especially in states with complex tax rules).
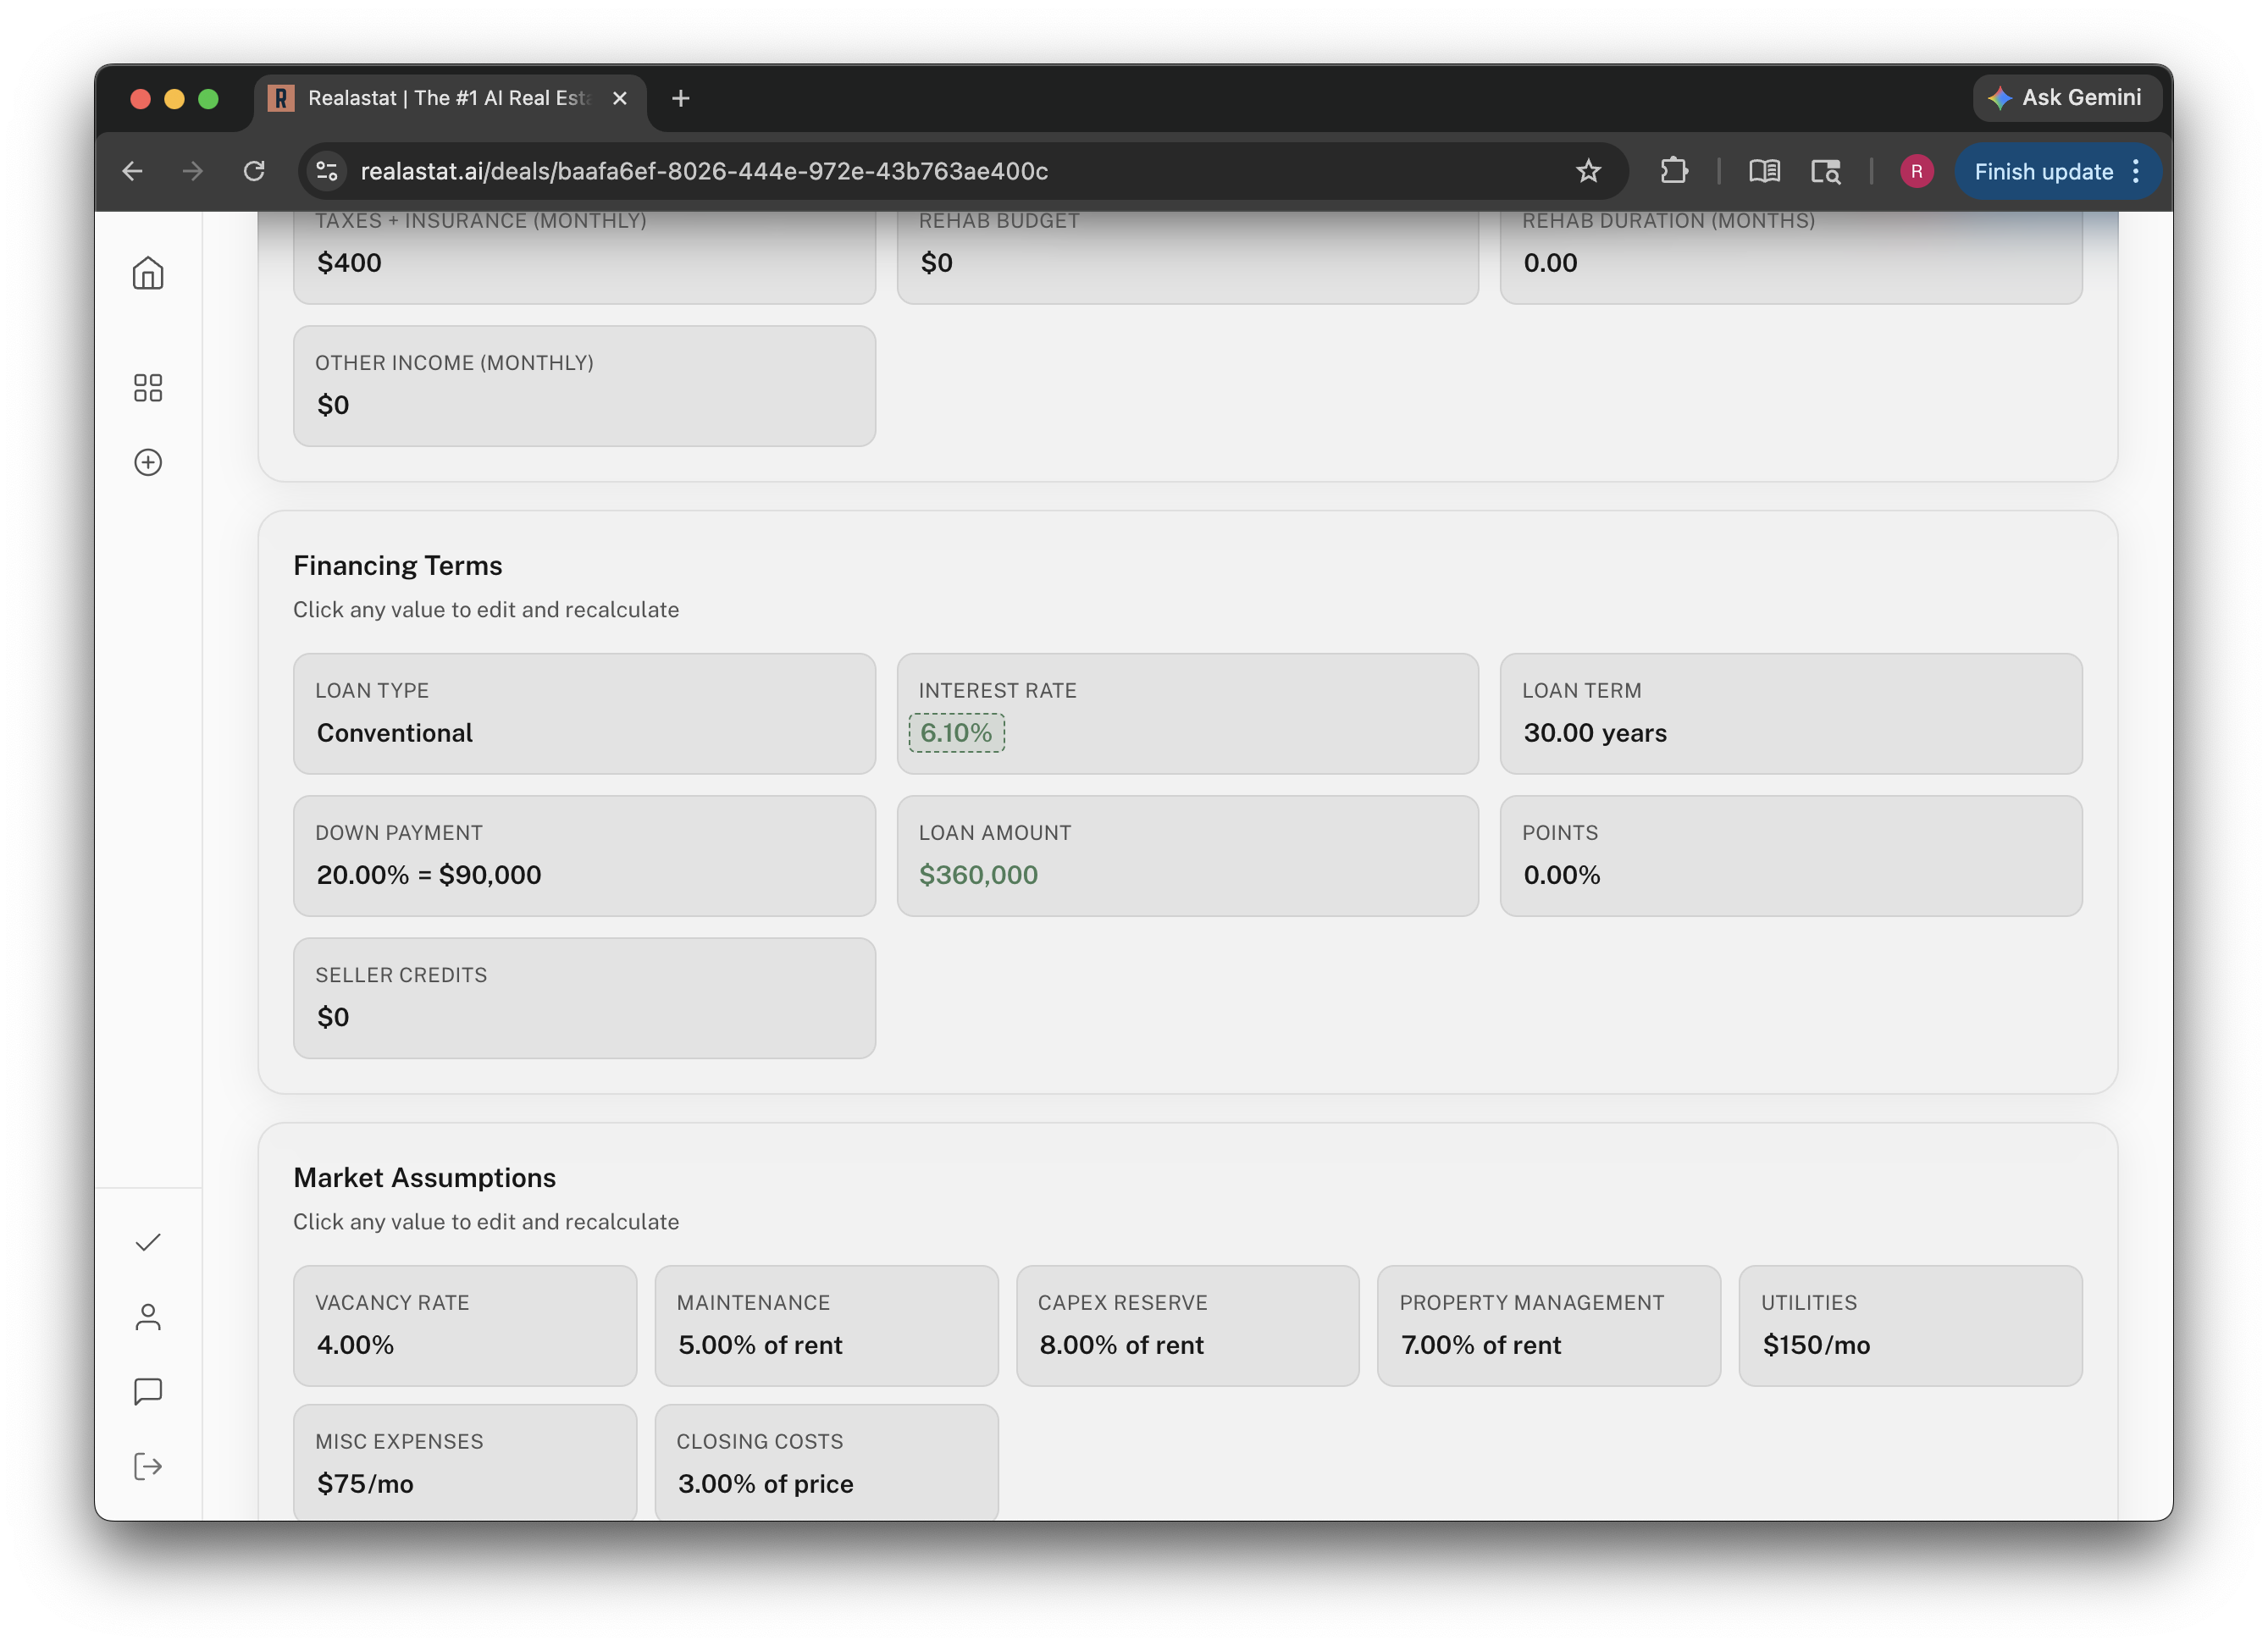
The operating expense assumptions are set from your regional market by default. You can leave them as-is for a first pass or adjust them to match what you know about the property.
Step 5: Read the key metrics in the right order
Once inputs look right, read the output metrics in this order:
- Monthly cash flow: Is there a positive margin of safety, or is this deal break-even at best?
- DSCR: Does it clear 1.2, the threshold most lenders require?
- Cash-on-cash return: Does it hit your personal minimum?
- Break-even rent: How much can rents fall before you are underwater on debt service?
- Max offer price: What is the most you can pay and still hit your targets?
Cap rate and GRM are also shown. Use them to benchmark this deal against others in the same market, not as decision-makers on their own.
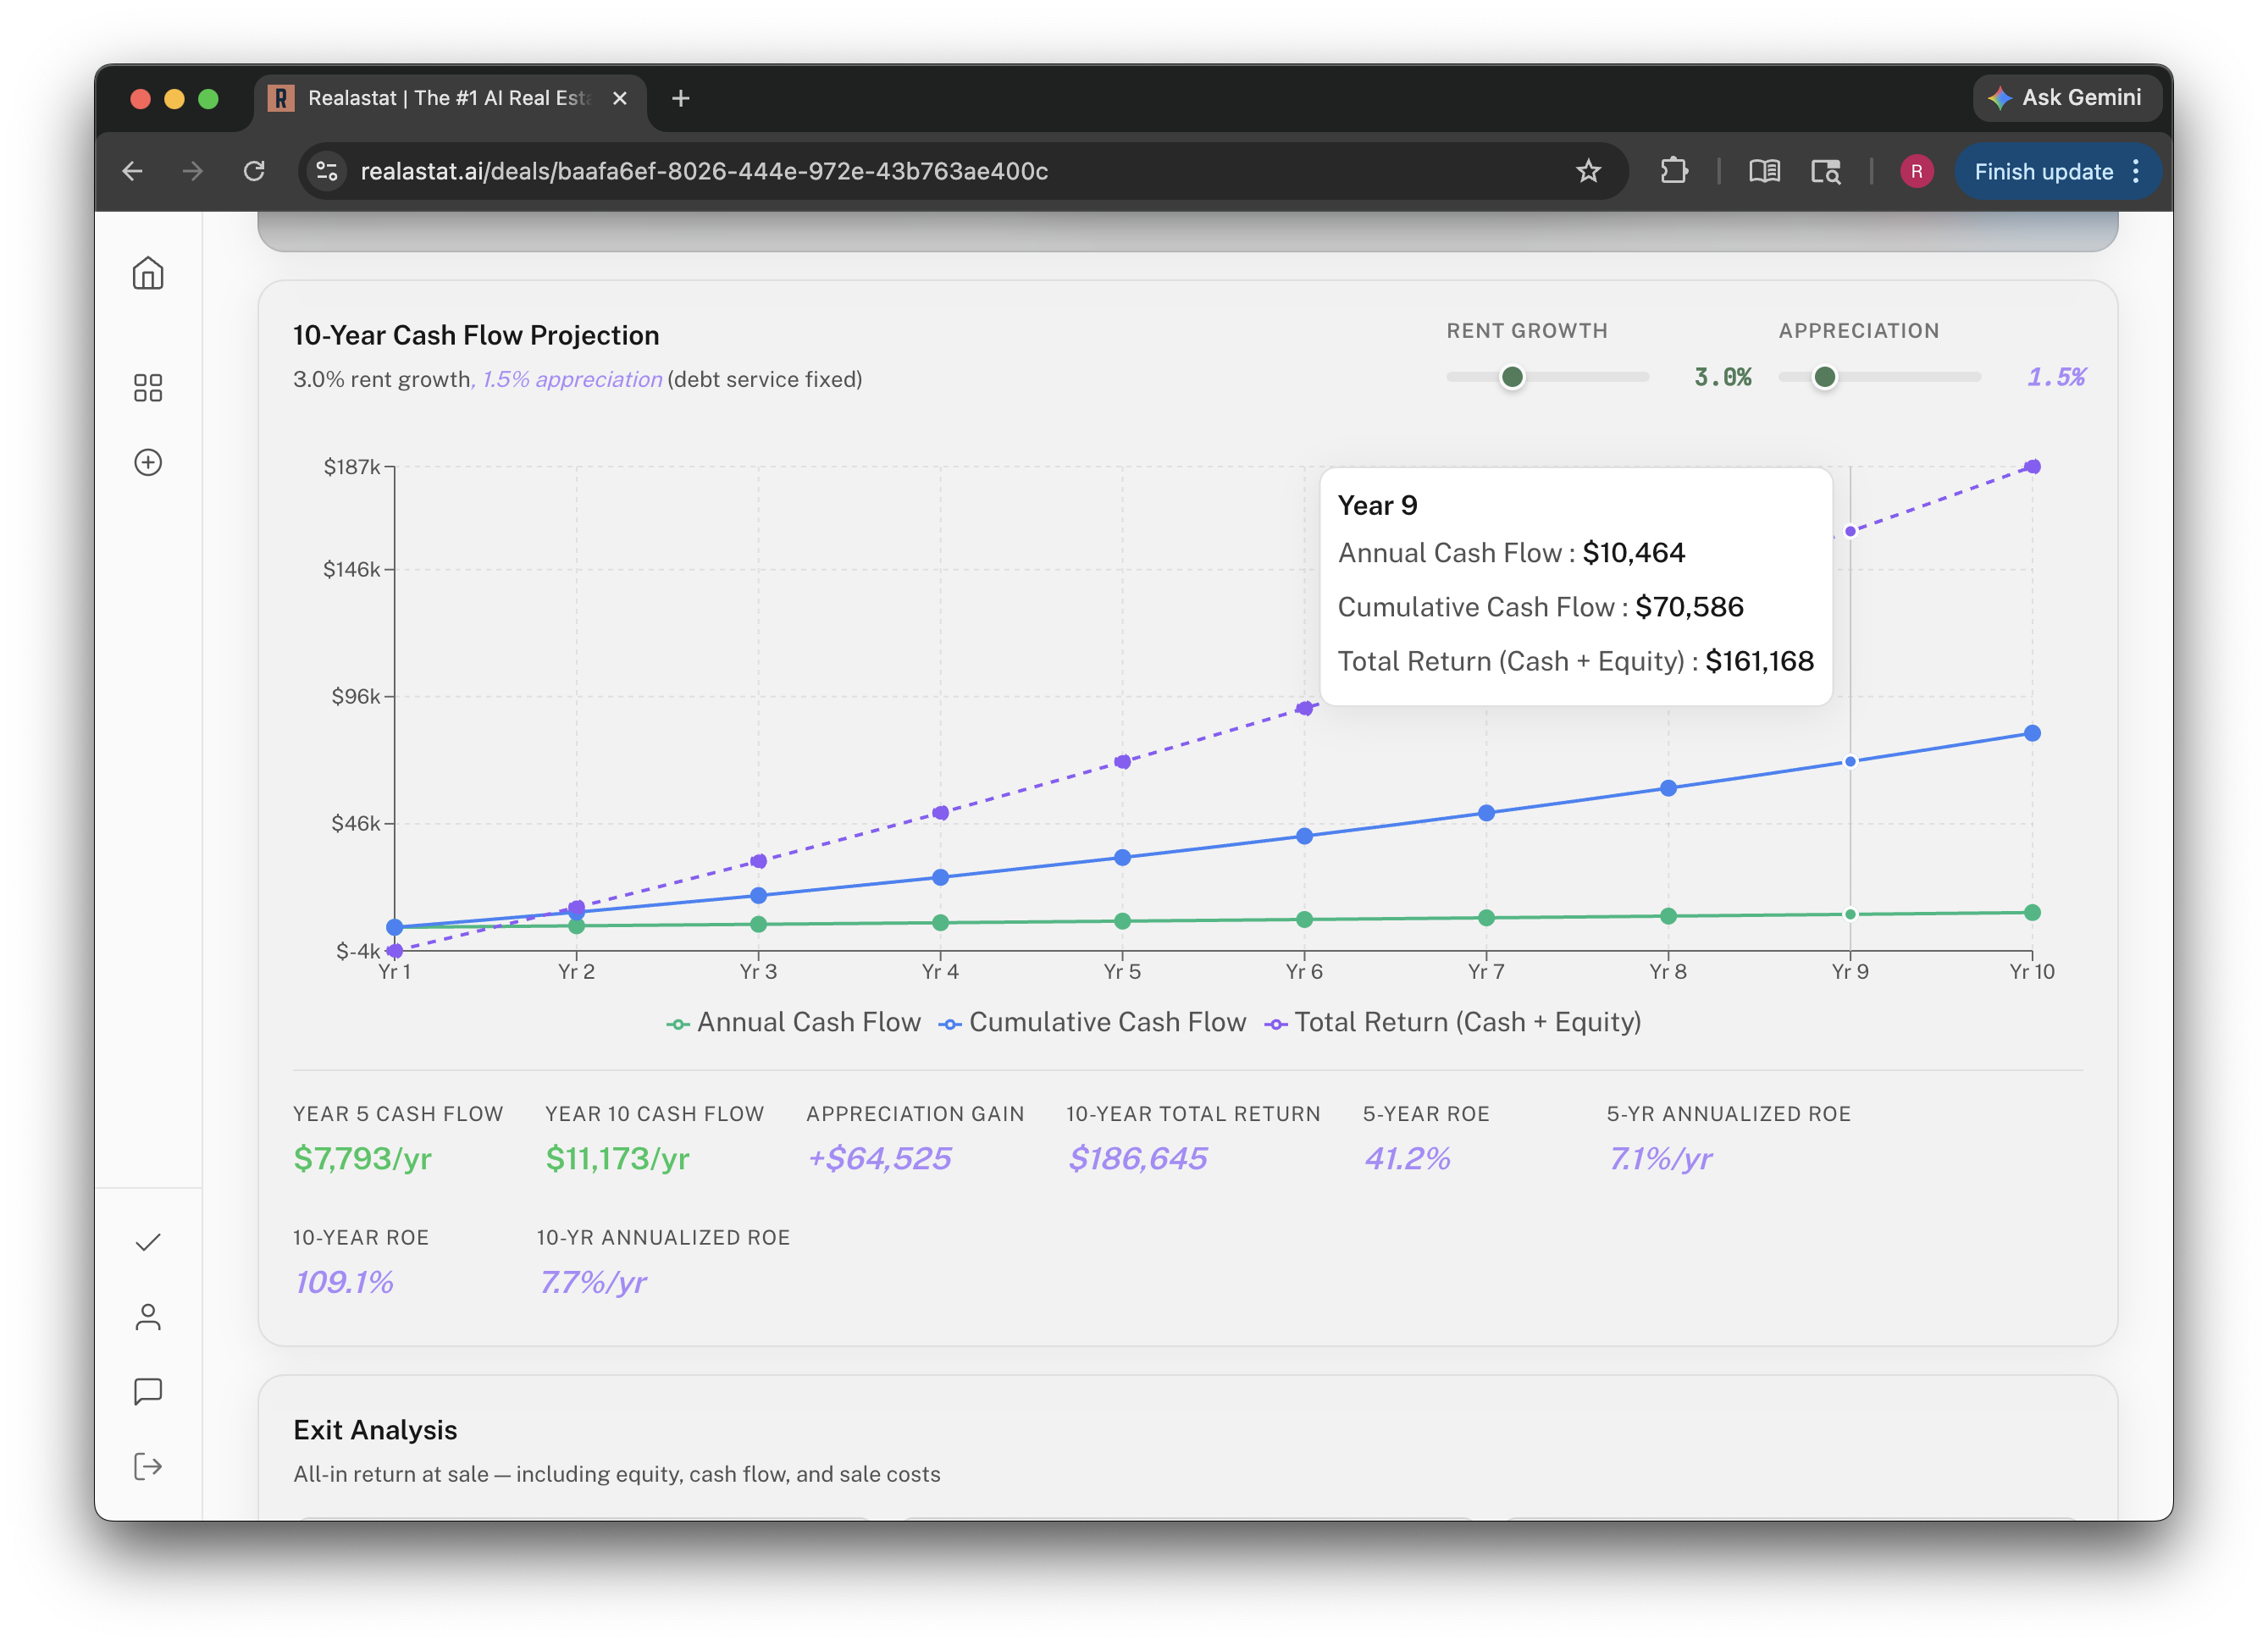
Step 6: Run scenarios before deciding
Before passing or pursuing a deal, run at least two additional scenarios. Change the rent assumption to something 10 to 15 percent below what you initially used. If the deal only works at the optimistic rent, that is a signal worth taking seriously.
You can also adjust interest rate, down payment, or purchase price to model how negotiation would affect the return. Every change recalculates all metrics instantly.
Why this works: AI does the boring part, math does the deciding
The key design decision behind Realastat is keeping these two things separate. AI handles extraction: pulling structured data out of messy, unstructured listing screenshots. Deterministic Python math handles the underwriting: every formula is hard-coded, reproducible, and auditable. You can verify every calculation.
AI does not predict whether the deal is a good investment. It does not generate a financial projection from market trends. It just reads the screenshot so you do not have to type. The math does the deciding.
Start free at realastat.ai. No credit card required. The free plan includes 3 full analyses to try the workflow.
Analyze your next rental deal in under a minute.
Try it free →